前言
xarray对于处理大型模式数据而言具有相当的优越性,尤其适用于高分辨率模型例如CMAQ, WRF-Chem等输出文件通常以数GB乃至几十GB大小)。用IDL和MATLAB读取这样的数据文件往往会导致内存溢出。下面以一个简单的例子来说明xarray的处理流程。
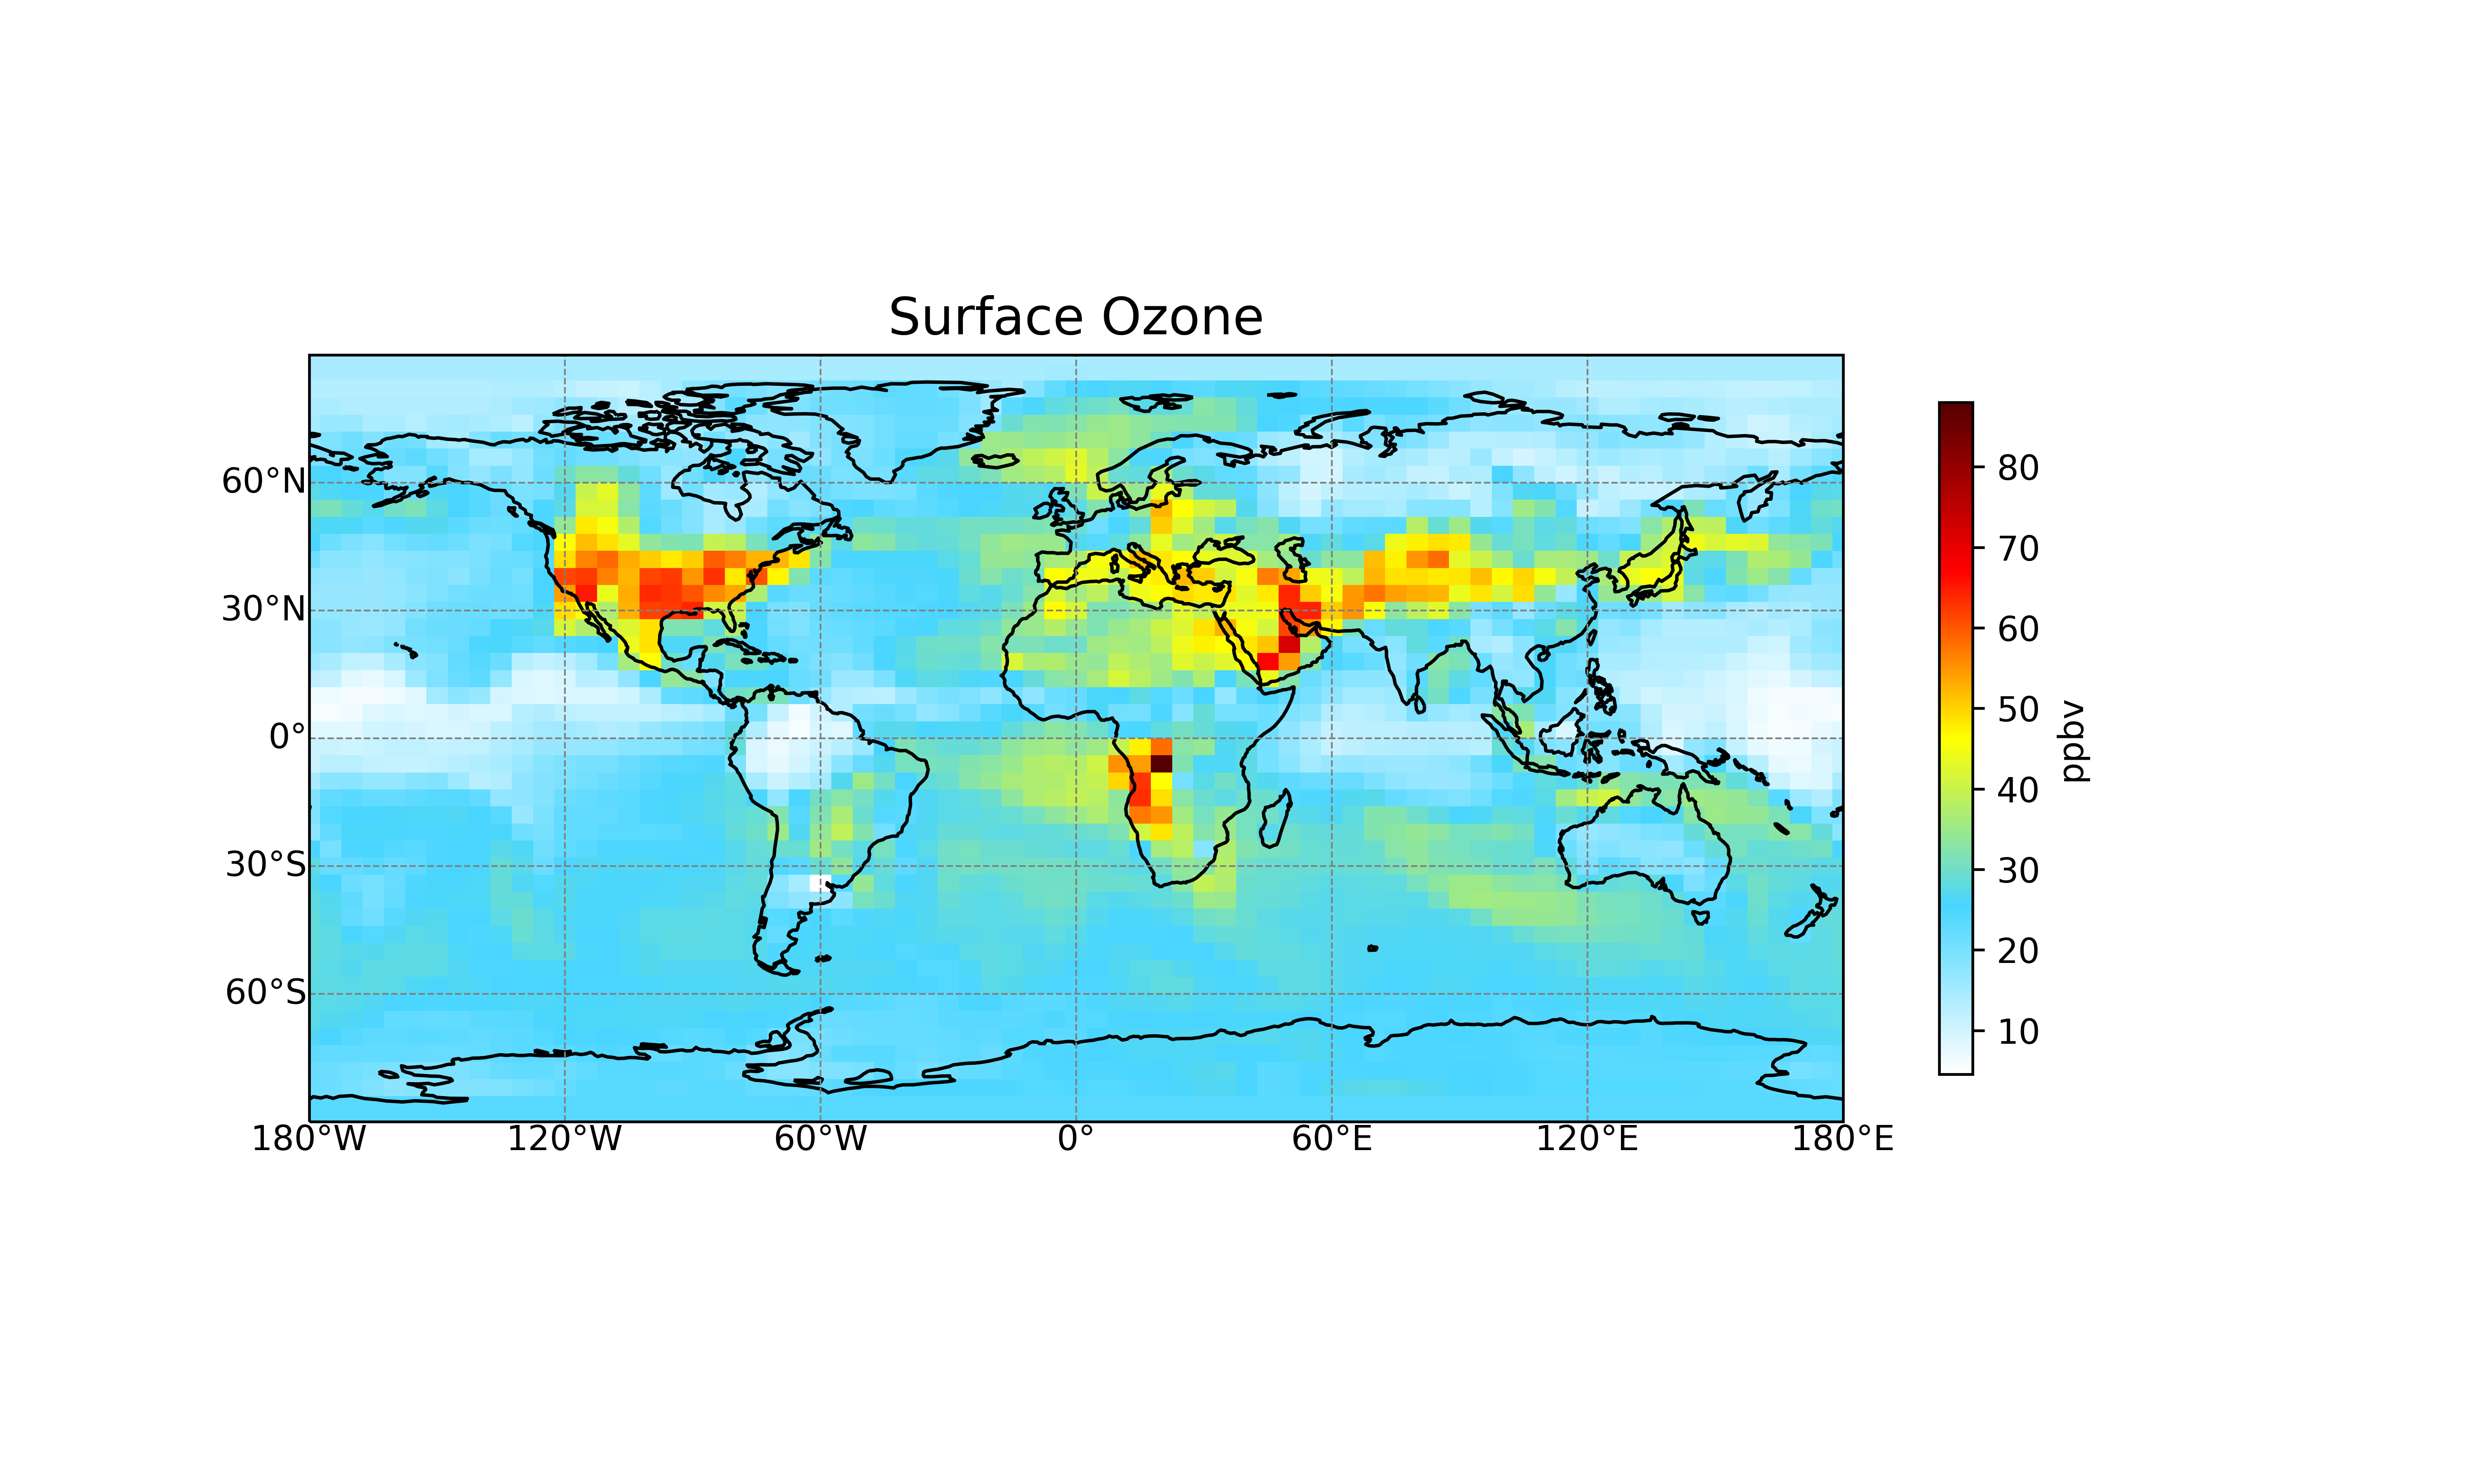
案例1-GEOS-Chem restart文件的全球臭氧浓度场
import numpy as np
import xarray as xr
import matplotlib.pyplot as plt
import cartopy.crs as ccrs
from matplotlib.colors import ListedColormap
WhGrYlRd_scheme = np.genfromtxt('D:/PythonLib/WhGrYlRd.txt', delimiter=' ')
WhGrYlRd = ListedColormap(WhGrYlRd_scheme/255.0)

from cartopy.mpl.gridliner import LONGITUDE_FORMATTER, LATITUDE_FORMATTER
import matplotlib.ticker as mticker

def add_latlon_ticks(ax):
    '''Add latlon label ticks and gridlines to ax
    '''
    gl = ax.gridlines(crs=ccrs.PlateCarree(),
                      draw_labels=True,
                      linewidth=0.5,
                      color='gray',
                      linestyle='--'
                     )
    gl.xlabels_top = False
    gl.ylabels_right = False
    gl.xformatter = LONGITUDE_FORMATTER
    gl.yformatter = LATITUDE_FORMATTER
    gl.ylocator = mticker.FixedLocator(np.arange(-90,91,30))

#------------Start to read files and variables-----------#

ds = xr.open_dataset("D:/PythonLib/initial_GEOSChem_rst.4x5_benchmark.nc")

# print(ds)

dr = ds['SpeciesRst_O3']
dr *= 1e9 # convert unit of v/v to ppbv

dr.attrs['units'] = 'ppbv' #rename the unit of variable

print(dr)
# We see the dimention as follows:
# Dimensions: (time: 1, lev: 72, ilev: 73, lat: 46, lon: 72)

# Then we try to get 1st time slice and 1st level

# Option #1 is:

rawdata = dr.values
data_surf = rawdata[0,0,:,:]
# Option #2 is:

dr_surf = dr.isel(time=0, lev=0)
print(dr_surf)
# Verify that both methods give the same result.

print(np.allclose(data_surf, dr_surf.values))
# note: Option 2 is recommended since this method doesn't required load all data.


lat = dr_surf['lat'].values
lon = dr_surf['lon'].values
print('lat:\n', lat)
print('lon:\n', lon)
#------------End to read files and variables--------------#

fig = plt.figure(figsize=[10,6])

ax = plt.axes(projection=ccrs.PlateCarree())
ax.coastlines()
plt.pcolormesh(lon, lat, dr_surf, cmap=WhGrYlRd)
plt.title('Surface Ozone', fontsize=15)

cb = plt.colorbar(shrink=0.6)
cb.set_label("ppbv")

add_latlon_ticks(ax) # add ticks and gridlines

fig.savefig('Surface_Ozone.png', dpi=600)
效果图如下所示:

案例2
import xarray as xr
ds = xr.open_dataset("./GEOSFP.20150701.A3cld.Native.nc")
print(ds)
#选择变量  注意尽量不要使用ds.load() 因为这会读取文件的所有数据 大文件的话直接导致python crash

#即使要使用load命令  也要尽量在选定了变量并设定了维度后执行

dr = ds['CLOUD'] # super fast
dr
#选择变量的某一维度  此处我们选择垂直高度的第1层  注意python的数组下标是从0开始的

dr_surf = dr.isel(lev=0) # super fast
dr_surf
dr_surf.isel(time=0).plot(cmap='Blues_r')

#案例2
ds = ds.chunk({'time': 1})
dr = ds['CLOUD']
dr
dr.mean(dim='lev')              #该行代码仅为查看数据  并未进行计算

dr.mean(dim='lev').compute()    #该行代码进行实际计算lev维度的平均

from dask.diagnostics import ProgressBar
with ProgressBar():
    dr_levmean = dr.mean(dim='lev').compute()

with ProgressBar():
    dr.mean(dim='lev').to_netcdf('column_average.nc')

xr.open_dataset('column_average.nc')

#以上命令可以简化为如下的2行代码

ds = xr.open_dataset("./GEOSFP.20150701.A3cld.Native.nc", chunks={'time': 1})
ds['CLOUD'].mean(dim='lev').to_netcdf('column_average_CLOUD.nc')
xarray结合dask可以将一个大型数组分成一个个数据块(chunk),需要注意的是我们需要沿着时间维操作,拟合需要整个时间维度的数据,因此时间维time不能分块,只能对其他维度分块。
x = xr.DataArray(rs.randn(500, 20, 1500, 1500), dims=["time", "lev", "lat","lon"])
x = x.chunk({"lev":5, "lat":100,"lon":100})
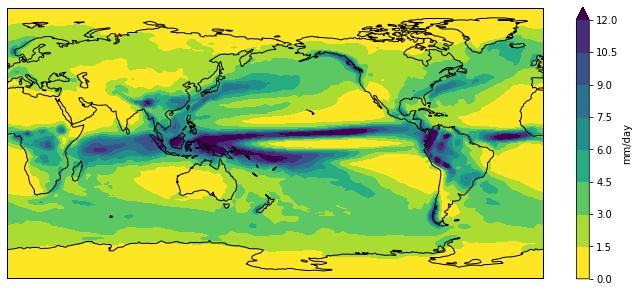
案例3-以CMIP5的全球降水数据为例求所有时次平均值并画出空间分布
首先通过简短的单个nc文件读取与画图引入
we want to convert the units from kg m-2 s-1 to something that we are a little more familiar with like mm day-1. To do this, consider that 1 kg of rain water spread over 1 m2 of surface is 1 mm in thickness and that there are 86400 seconds in one day. Therefore, 1 kg m-2 s-1 = 86400 mm day-1.
import xarray as xr
import cartopy.crs as ccrs
import matplotlib.pyplot as plt
import numpy as np

accesscm2_pr_file = './pr_Amon_ACCESS-CM2_historical_r1i1p1f1_gn_201001-201412.nc'
dset = xr.open_dataset(accesscm2_pr_file)
#对所有时次求平均
clim = dset['pr'].mean('time', keep_attrs=True)
clim.data = clim.data * 86400
clim.attrs['units'] = 'mm/day'

fig = plt.figure(figsize=[12,5])
ax = fig.add_subplot(111, projection=ccrs.PlateCarree(central_longitude=180))
clim.plot.contourf(ax=ax,
                   levels=np.arange(0, 13.5, 1.5),
                   extend='max',
                   transform=ccrs.PlateCarree(),
                   cbar_kwargs={'label': clim.units},
                   cmap='viridis_r'
                  )
ax.coastlines()
picpath = 'CMIP6-rain.png'
plt.savefig(picpath,dpi=600,bbox_inches = 'tight')
plt.show()
效果图如下所示:

在上一个代码的基础上修改为求季节平均而非所有时次平均
import xarray as xr
import cartopy.crs as ccrs
import matplotlib.pyplot as plt
import numpy as np

accesscm2_pr_file = './pr_Amon_ACCESS-CM2_historical_r1i1p1f1_gn_201001-201412.nc'

dset = xr.open_dataset(accesscm2_pr_file)

clim = dset['pr'].groupby('time.season').mean('time', keep_attrs=True)
clim.data = clim.data * 86400
clim.attrs['units'] = 'mm/day'

fig = plt.figure(figsize=[12,5])
ax = fig.add_subplot(111, projection=ccrs.PlateCarree(central_longitude=180))
clim.sel(season='DJF').plot.contourf(ax=ax,
                                     levels=np.arange(0, 13.5, 1.5),
                                     extend='max',
                                     transform=ccrs.PlateCarree(),
                                     cbar_kwargs={'label': clim.units},
                                     cmap='viridis_r'
                                    )
ax.coastlines()
title = 'precipitation climatology (JJA)'
plt.title(title)
plt.show()
代码实现
map_funcs.py文件的代码:用于快速绘制中国地图
#-------------------------------------------

# 2019-09-10

# 绘制地图用的函数.

#-------------------------------------------
import matplotlib.ticker as mticker
import matplotlib.patches as mpatches
import cartopy.crs as ccrs
import cartopy.io.shapereader as shpreader
from cartopy.mpl.ticker import LongitudeFormatter, LatitudeFormatter

def add_Chinese_provinces(ax, **kwargs):
    '''
    在地图上画出中国省界的shapefile.

    Parameters
    ----------
    ax : GeoAxes
        目标地图.

    **kwargs
        绘制shape时用到的参数.例如linewidth,edgecolor和facecolor等.
    '''
    proj = ccrs.PlateCarree()
    reader = shpreader.Reader('D:/maps/shps/bou2_4p.shp')
    provinces = reader.geometries()
    ax.add_geometries(provinces, proj, **kwargs)
    reader.close()

def set_map_extent_and_ticks(
    ax, extents, xticks, yticks, nx=0, ny=0,
    xformatter=None, yformatter=None
):
    '''
    设置矩形投影的地图的经纬度范围和刻度.

    Parameters
    ----------
    ax : GeoAxes
        目标地图.支持_RectangularProjection和Mercator投影.

    extents : 4-tuple of float or None
        经纬度范围[lonmin, lonmax, latmin, latmax].值为None表示全球.

    xticks : array_like
        经度主刻度的坐标.

    yticks : array_like
        纬度主刻度的坐标.

    nx : int, optional
        经度主刻度之间次刻度的个数.默认没有次刻度.
        当经度不是等距分布时,请不要进行设置.

    ny : int, optional
        纬度主刻度之间次刻度的个数.默认没有次刻度.
        当纬度不是等距分布时,请不要进行设置.

    xformatter : Formatter, optional
        经度主刻度的Formatter.默认使用无参数的LongitudeFormatter.

    yformatter : Formatter, optional
        纬度主刻度的Formatter.默认使用无参数的LatitudeFormatter.
    '''
    # 设置主刻度.
    proj = ccrs.PlateCarree()
    ax.set_xticks(xticks, crs=proj)
    ax.set_yticks(yticks, crs=proj)
    # 设置次刻度.
    xlocator = mticker.AutoMinorLocator(nx + 1)
    ylocator = mticker.AutoMinorLocator(ny + 1)
    ax.xaxis.set_minor_locator(xlocator)
    ax.yaxis.set_minor_locator(ylocator)

    # 设置Formatter.
    if xformatter is None:
        xformatter = LongitudeFormatter()
    if yformatter is None:
        yformatter = LatitudeFormatter()
    ax.xaxis.set_major_formatter(xformatter)
    ax.yaxis.set_major_formatter(yformatter)

    # 在最后调用set_extent,防止刻度拓宽显示范围.
    if extents is None:
        ax.set_global()
    else:
        ax.set_extent(extents, crs=proj)

def add_box_on_map(ax, extents, **rect_kw):
    '''
    在地图上画出一个方框.

    Parameters
    ----------
    ax : GeoAxes
        目标地图.最好为矩形投影,否则效果可能很糟.

    extents : 4-tuple of float
        方框的经纬度范围[lonmin, lonmax, latmin, latmax].

    **rect_kw
        创建Rectangle时的关键字参数.
        例如linewidth,edgecolor和facecolor等.
    '''
    lonmin, lonmax, latmin, latmax = extents
    rect = mpatches.Rectangle(
        (lonmin, latmin), lonmax - lonmin, latmax - latmin,
        transform=ccrs.PlateCarree(), **rect_kw
    )
    ax.add_patch(rect)
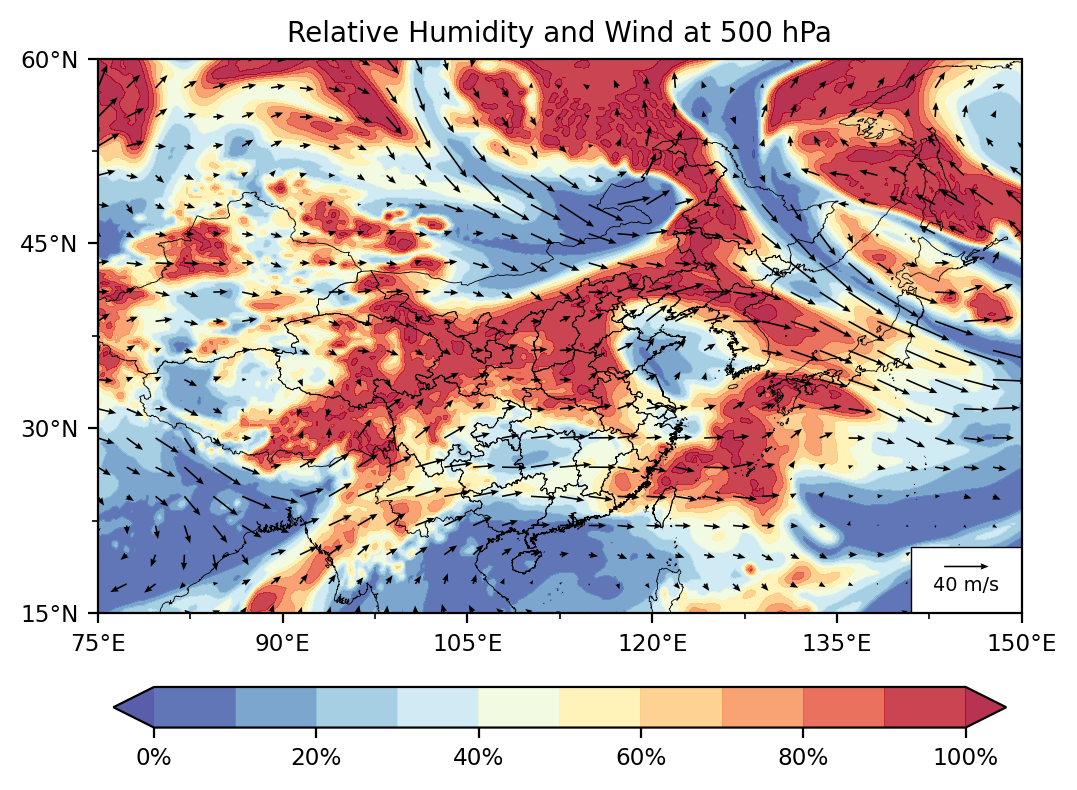
画ERA5数据在500hPa高度的相对湿度和水平风场
import numpy as np
import xarray as xr
import matplotlib.pyplot as plt
import matplotlib.ticker as mticker
import matplotlib.patches as mpatches
import cartopy.crs as ccrs

from map_funcs import add_Chinese_provinces, set_map_extent_and_ticks

if __name__ == '__main__':
    # 设置绘图区域.
    lonmin, lonmax = 75, 150
    latmin, latmax = 15, 60
    extents = [lonmin, lonmax, latmin, latmax]

    # 读取extents区域内的数据.
    filename = 't_uv_rh_gp_ERA5.nc'
    with xr.open_dataset(filename) as ds:
        # ERA5文件的纬度单调递减,所以先反转过来.
        ds = ds.sortby(ds.latitude)
        ds = ds.isel(time=0).sel(
            longitude=slice(lonmin, lonmax),
            latitude=slice(latmin, latmax),
            level=500
        )

    proj = ccrs.PlateCarree()
    fig = plt.figure()
    ax = fig.add_subplot(111, projection=proj)

    # 添加海岸线和中国省界.
    ax.coastlines(resolution='10m', lw=0.3)
    add_Chinese_provinces(ax, lw=0.3, ec='k', fc='none')
    # 设置经纬度刻度.
    set_map_extent_and_ticks(
        ax, extents,
        xticks=np.arange(-180, 190, 15),
        yticks=np.arange(-90, 100, 15),
        nx=1, ny=1
    )
    ax.tick_params(labelsize='small')

    # 画出相对湿度的填色图.
    im = ax.contourf(ds.longitude, ds.latitude,
                     ds.r,
                     levels=np.linspace(0, 100, 11),
                     cmap='RdYlBu_r',
                     extend='both',
                     alpha=0.8
                     )
    cbar = fig.colorbar(im,
                        ax=ax,
                        shrink=0.9,
                        pad=0.1,
                        orientation='horizontal',
                        format=mticker.PercentFormatter()
                        )
    cbar.ax.tick_params(labelsize='small')

    # 画出风箭头.直接使用DataArray会报错,所以转换成ndarray.
    Q = ax.quiver(ds.longitude.values, ds.latitude.values,
                  ds.u.values,
                  ds.v.values,
                  scale_units='inches',
                  scale=180,
                  angles='uv',
                  units='inches', width=0.008, headwidth=4,
                  regrid_shape=20,
                  transform=proj
                  )
    # 在ax右下角腾出放图例的空间.
    # zorder需大于1,以避免被之前画过的内容遮挡.
    w, h = 0.12, 0.12
    rect = mpatches.Rectangle(
        (1 - w, 0), w, h, transform=ax.transAxes,
        fc='white', ec='k', lw=0.5, zorder=1.1
    )
    ax.add_patch(rect)
    # 添加风箭头的图例.
    qk = ax.quiverkey(
        Q, X=1-w/2, Y=0.7*h, U=40,
        label=f'{40} m/s', labelpos='S', labelsep=0.05,
        fontproperties={'size': 'x-small'}
    )

    title = 'Relative Humidity and Wind at 500 hPa'
    ax.set_title(title, fontsize='medium')

    fig.savefig('rh_wnd.png', dpi=200, bbox_inches='tight')
    plt.close(fig)

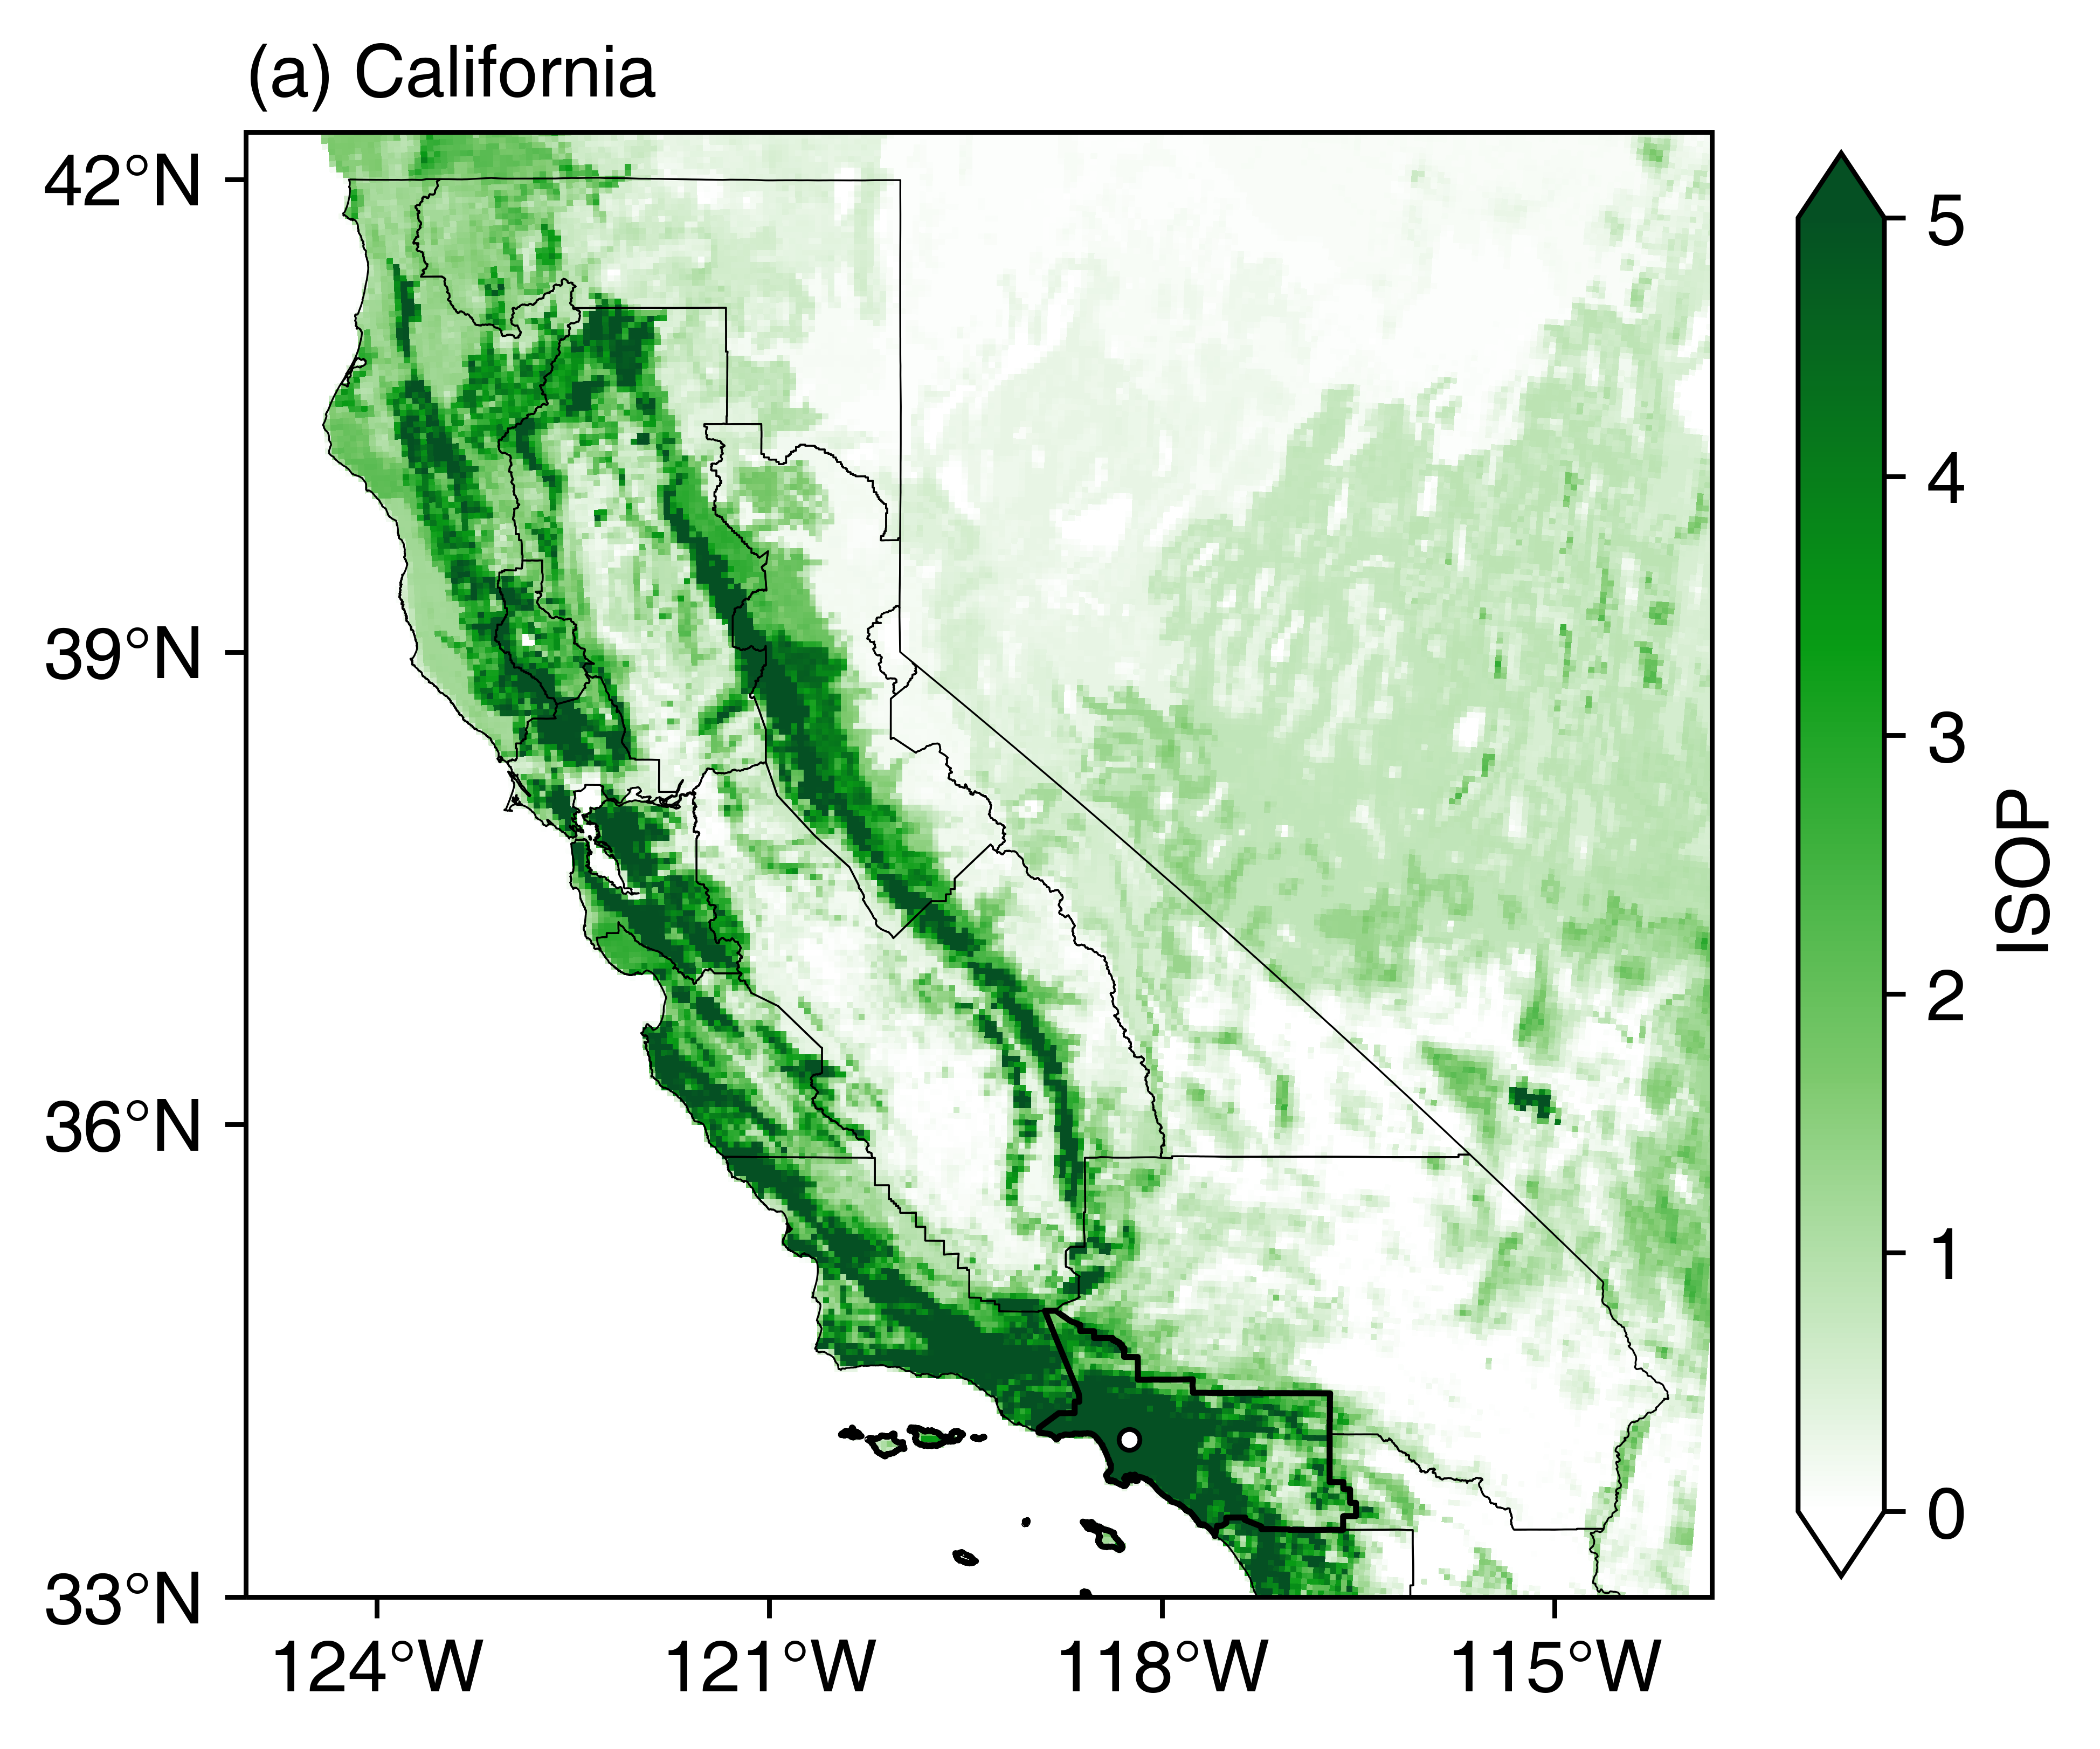
画图-加州的异戊二烯排放因子空间分布
示例代码如下:
import numpy as np
import matplotlib.pyplot as plt
import matplotlib as mpl
import cartopy
import cartopy.crs as ccrs
import cartopy.feature as cfeature
import shapely.geometry as sgeom
import pandas as pd
from cartopy.mpl.gridliner import LatitudeFormatter, LongitudeFormatter
from cartopy.io.shapereader import Reader
from copy import copy
import geopandas
import xarray as xr
import cmaps

ncfile = xr.open_dataset('D:/python-scripts/MEGAN-ISOP-EF/EFMAPS.CA04.nc')
lons = ncfile['LONG'][0,0]
lats = ncfile['LAT'][0,0]
isop = ncfile['EF_ISOP'][0,0]

df = pd.read_excel('D:/python-scripts/MEGAN-ISOP-EF/city.xls')
lon = df['lons']
lat = df['lats']
# name = df['site_name']

shp = geopandas.read_file('D:/MEGAN-ISOP-EF/shp/CaAirBasin_WGS1984.shp')
shp = shp[shp['NAME'] == 'South Coast']

shpfile = Reader(r'D:/shp/CaAirBasin_WGS1984.shp')
shape_feature1 = cfeature.ShapelyFeature(shpfile.geometries(),ccrs.PlateCarree(), facecolor='none',edgecolor='black',linewidths=0.3)

#设置填色图投影方式,以及地图边界
proj = ccrs.PlateCarree()
leftlon, rightlon, lowerlat, upperlat = (-125,-113.8,33,42.3)
img_extent = [leftlon, rightlon, lowerlat, upperlat]

#建立画布
fig = plt.figure(figsize=(20,15))
ax = fig.add_axes([0, 0, 0.17, 0.3],projection = proj)

data_proj = cartopy.crs.PlateCarree()
ax.set_extent([leftlon, rightlon, lowerlat, upperlat])
ax.set_xticks(np.arange(-124,-113,3), crs=ccrs.PlateCarree())
ax.set_yticks(np.arange(33,44,3), crs=ccrs.PlateCarree())

lon_formatter = LongitudeFormatter()
lat_formatter = LatitudeFormatter()
ax.xaxis.set_major_formatter(lon_formatter)
ax.yaxis.set_major_formatter(lat_formatter)
labels = ax.get_xticklabels() + ax.get_yticklabels()
[label.set_fontname('helvetica') for label in labels]
plt.tick_params(labelsize=12)

ax.set_title('(a) California',
             loc='left',
             size=12,
             fontdict = {'family' :  'Helvetica','weight' : 'bold'}
            )
ax.add_feature(shape_feature1)
shp.boundary.plot(ax=ax, color='black',linewidths=1)
ax.scatter(lon,lat,alpha=1,s=12,zorder=6,transform=ccrs.PlateCarree(),color='black',marker='o',facecolor='White',linewidths=0.8)

c = ax.pcolormesh(lons,lats,
                  isop/1000,
                  transform=ccrs.PlateCarree(),
                  cmap=cmaps.WhiteGreen,
                  vmin=0,
                  vmax=5,
                 )

df = pd.read_excel('D:/python-scripts/MEGAN-ISOP-EF/labels.xls')
lon = df['lons']
lat = df['lats']
name = df['site_name']

#colorbar设置
position=fig.add_axes([0.18, 0.04, 0.01, 0.22])
cb = fig.colorbar(c,
                  cax=position,
                  orientation='vertical',
                  extend='both'
                 )

for l in cb.ax.yaxis.get_ticklabels():
    l.set_family('Helvetica')
cb.ax.tick_params(labelsize=12)
cb.set_label('ISOP',size=12,family='Helvetica')

picpath = 'CA_ISOP.png'
plt.savefig(picpath,dpi=800,bbox_inches = 'tight')

参考文献及链接
Python for Atmosphere and Ocean Scientists
https://carpentries-lab.github.io/python-aos-lesson/